GMT6管理模块-subplot
首先明确一点,用的MATLAB的可能都知道这个模块,他们的功能也是一模一样的。
subplot
把画布分成几个子块。
- subplot begin:控制整个画布的属性
必选项:- nrows××x××ncows
指定图件的维度,有几行几列,如2x3,(注意两个数字中间时字母x) -
F[f s]width(s)/height(s)[:wfracs/hfracs]
- Ff
指定最终图件的维度,注意指定宽度度和高度时标识、刻度等不在之内,但之后GMT会自动计控制图件的间距,指定不同行列的宽高的方式:
如:-Ff4i/4i:3,2/1,2: 表示图件总宽和高都是4inch,第二个//前是宽度比,3:1,后面是高度比,1:2
-Fs
为每个子图指定维度,如-Fs2i,3i/3i表示第一列2inch宽,第二列3inch宽,高度都是3inch。注意:
对于地理投影,高度由区域大小和投影方式决定,因此,-J后面只需要投影方式,不带比例和子图大小
- nrows××x××ncows
- 整个图件布局完用:gmt end
- 每个子图开始绘制之前:
gmt subplot set
- 必选项: row,col:指定画第几行第几列的图
- 可选项:
-A
-C
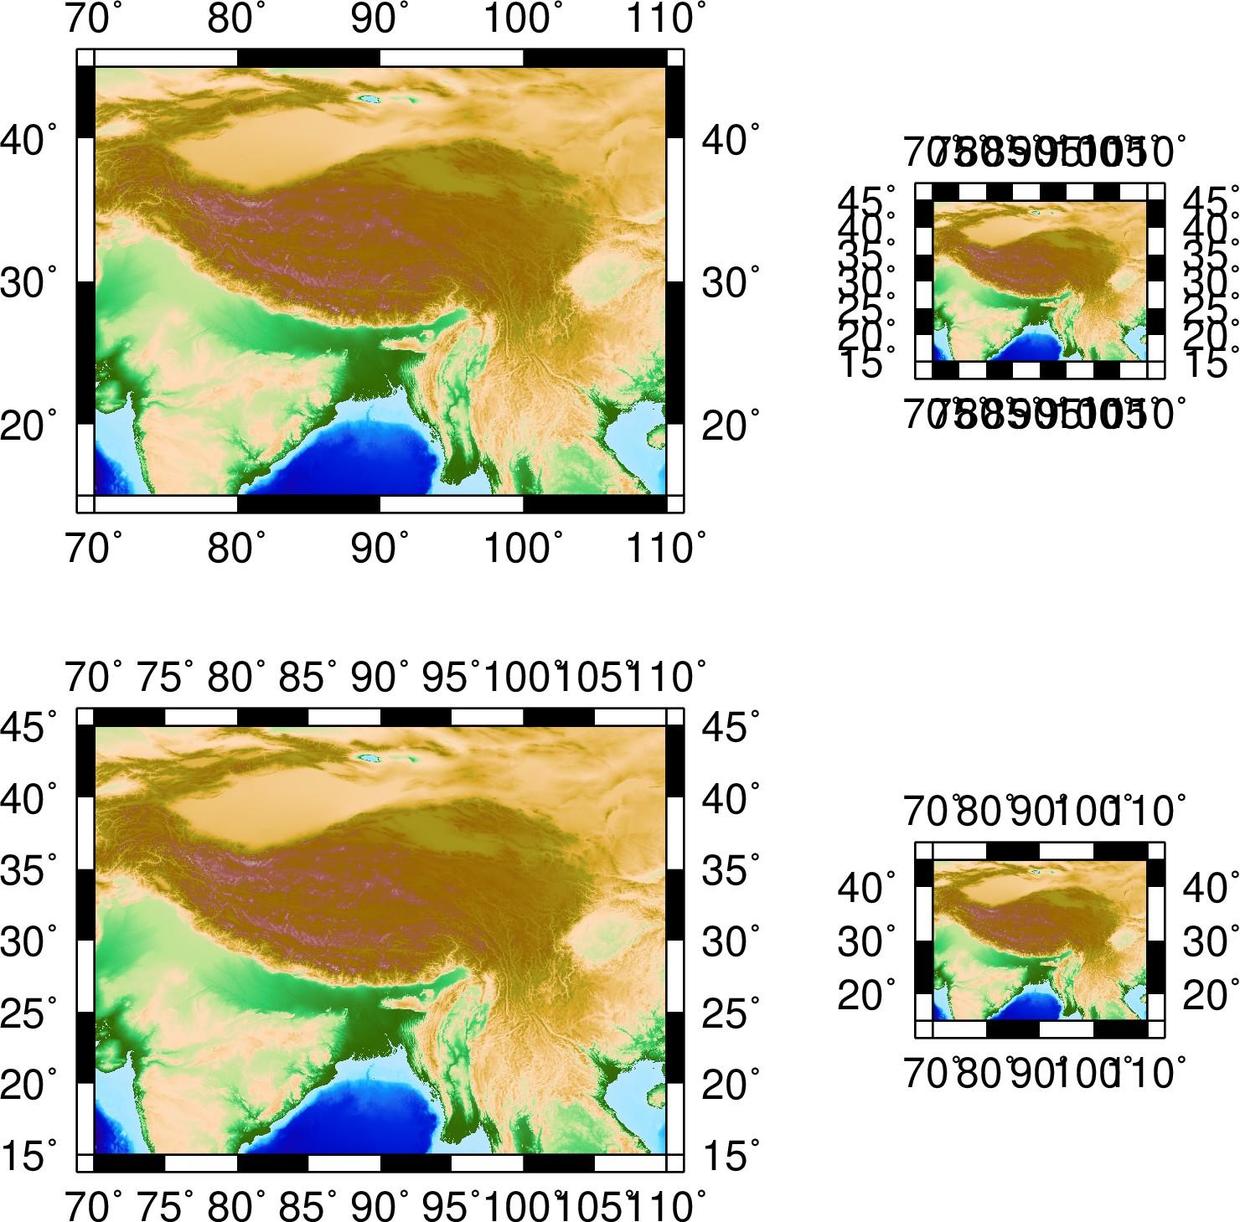
脚本:
#!/bin/bash

gmt begin map jpg
gmt set FONT_TITLE=24p,Helvetica-Bold
gmt subplot begin 2x2 -Ff10c/10c:3,1/2,2
gmt subplot set 1,1
gmt grdimage Tibet_topo.grd -R70/110/15/45 -Jx -B10 -Cetopo1
gmt subplot set 1,2
gmt grdimage Tibet_topo.grd -R70/110/15/45 -Jx -B5 -Cetopo1
gmt subplot set 2,1
gmt grdimage Tibet_topo.grd -R70/110/15/45 -Jx -B5 -Cetopo1
gmt subplot set 2,2
gmt grdimage Tibet_topo.grd -R70/110/15/45 -Jx -B10 -Cetopo1
gmt subplot end
gmt end
gmt clear all

#gmt end